
Pure Indexing, Flirting with Factors, and Finding Intermediaries: Thoughts on Addressing Three-Fund Portfolio Inefficiencies
Published:
All code, data, and plots for this post are available on GitHub.
Post Rationale
Recently having finished Andrew Ang’s book “Asset Management: A Systematic Approach to Factor Investing” and also having reread the newest 50th anniversary edition version of Burton Malkiel’s “A Random Walk Down Wall Street” a second time, I wanted to more deeply think about indexing inefficiencies that low-cost fund combinations of international and US equity ETFs like VTI and VXUS inherently have, and how literature-informed companies like Dimensional provide “Market” type funds that address these inefficiencies, without me needing to necessarily fully commit to the idea of factor tilting yet. Thus, the aim here is to essentially still capture market beta (being slightly optimized with higher net returns), where DFUS seems to be a replacement for VTI for the US Market, but there is no simple total international Market replacement for VXUS.
This post is just a string of structured thoughts, so any constructive feedback would be greatly appreciated, especially if you can help solve the dilemma that lead me to write this post in the first place. Most importantly, none of this is financial advice.
Overview
The post is structured as follows, where I try to think through some (I believe) given basics at a high level.
- Index Funds: The Evidence-Based Path - Why broad market indexing works (for the average retail investor such as myself)
- The Science Behind Indexing - CAPM, EMH, and Modern Portfolio Theory foundations
- Factors - Possibly moving beyond market beta to capture additional risk premiums
- The Three-Fund Portfolio - Bogleheads approach with VTI/VXUS/BND
- VTI vs DFUS - Upgrading US equity exposure
- The International Challenge - Why finding a “VXUS 2.0” is complicated
- Quantifying Factor Exposures: 5-Factor Regressions - Measuring systematic risk with Fama-French
- References - Sources
Index Funds: The Evidence-Based Path to Wealth
Investing can be mind-numbingly complex, but one simple strategy has seemingly stood the test of time (for average retail investors such as myself): broad market index funds. Decades ago, economist Burton Malkiel asserted (Malkiel, 2023) that ordinary investors are better off buying and holding a low-cost index fund than trying to pick stocks or hire expensive active managers. He backed it up with hard data: ten thousand dollars invested in an S&P 500 index fund in 1969 grew to over 736 thousand dollars by 2014, dramatically outpacing the 501 thousand dollar result from the average actively managed fund (whose fees and trading shenanigans ate into returns). In the long run, the index fund investor came out about 50% richer than the fund-pickers on average. No stock-tipping magic required. Making this more accessible to the general public more recently, personal finance author JL Collins is on the same page (whose book was my first exposure to understanding indexing in an accessible manner quite a while back). In The Simple Path to Wealth (Collins, 2016), Collins boils investing down to a few core rules: spend less than you earn, avoid debt, and invest the rest in low-cost index funds. It doesn’t get much simpler (or more behaviorally sensible) than that. Collins basically says: you can become a millionaire just by consistently adding money into a total market index fund or ETF equivalent (like Vanguard’s VTI or VTSAX). Both Malkiel and Collins cite mountains of evidence that passive index investing beats most active strategies after costs. In other words, you’re better off buying “the haystack” (the entire market) than searching for that one needle of a hot stock. Why do index funds win so often? Enter some foundational finance theory (as I understand it).
The Science Behind Indexing
If the idea of efficient markets and modern portfolio theory makes you glaze over, don’t worry, I’ll try to keep this gentle (I’ll keep the math as I understand it for a future post), I promise. The key insight from Nobel-winning research of the 1950s-1960s is that diversification is one of the only free lunches in investing. Harry Markowitz showed that by holding a broad portfolio of assets, you can maximize your expected return for any given level of risk (Markowitz, 1952). He introduced the concept of an efficient frontier, which is basically the set of optimal portfolios that offer the highest return for a given risk level. The practical takeaway is to not put all your eggs in one basket, but simply hold the whole market basket. By spreading out, you reduce risk without sacrificing much return. Building on that, the Capital Asset Pricing Model (CAPM) took Markowitz’s work a step further (Sharpe, 1964). CAPM said if everyone diversifies perfectly, the market portfolio (i.e. an index of everything) is the optimal mix. In CAPM-world, a stock’s expected return relates to how much it moves with the market (its beta). The market itself is the only risk factor you get paid for and everything else (company-specific ups and downs) gets diversified away. In plainer terms, CAPM implies that the market index is king, implying it is the most efficient, and the only thing that reliably drives returns. Trying to beat the market by picking stocks or timing sectors is, on average, a zero-sum game (If you are not an institutional investor like Renaissance Technologies). For every winner, there is a loser, especially after fees. This ties nicely to the Efficient Market Hypothesis (EMH), articulated by Eugene Fama in 1970 (Fama, 1970). EMH argues that all available information is quickly baked into asset prices. If that is true, consistently outsmarting the market is about as easy as consistently flipping heads on a coin for the average investor. Prices move in a “random walk”, essentially unpredictable, because any new info (earnings surprise, Fed decision, etc.) gets rapidly absorbed by thousands of rational (and not-so-rational) market participants. The implication for us average retail investors: you can’t reliably find underpriced gems, so don’t waste time trying. Instead, just buy an index fund and get the market return, which by definition beats most investors after costs. EMH isn’t perfect (markets can seemingly get a little crazy at times) and a small number of elite hedge funds consistently appear to outperform the market net fees if I understand things correctly, but by and large even most professional fund managers struggle to beat a simple index over the long haul.
So far we’ve covered that index funds, capturing the broad market, are backed by strong theory (CAPM, EMH) and empirical results. You get market beta (the return of the market) cheap and easy, which historically has been quite generous over decades. As Malkiel mentions, a broad index fund guarantees you’ll always get the average market return, and since the market is the average of all investors, being average actually puts you ahead of most, once you factor in the hefty fees and mistakes others make. But (there’s always seemingly a “but” in finance), academics keep digging. They found there might be more to returns than just the market. Not all “average” is created equal, which brings us to factor investing.
Factors
Let’s say we’ve embraced the previous assumptions about index funds as a foundational approach. Does that mean there’s no way to tweak things for potentially better returns (at acceptably higher risk)? Enter factor investing, sometimes branded as “smart beta” (a marketing term Jack Bogle himself snarked was “smart beta is stupid”, and he didn’t mince words on this topic). In more polite terms, factor investing is an extension of the CAPM that recognizes multiple drivers of returns beyond just market beta. Let us think of the market like an all-you-can-eat buffet. CAPM said “just fill your plate with a bit of everything to be optimal.” Factor investing says “well, maybe some sections of the buffet consistently give more nutrition per calorie.” In fact, Columbia professor Andrew Ang famously put it this way: “Factors are to assets what nutrients are to food” (Ang, 2014). Stocks and portfolios are just bundles of underlying “nutrients” (risk factors) that drive returns. Instead of just accepting the whole market basket as-is, factor investors tilt their portfolios toward certain factors, traits like size, value, momentum, quality/profitability, etc (where understanding factors and their possible stability/decay over time would and probably will be a whole other future post of mine that I am currently thinking about), that research has shown offer long-term return premiums. Where did these ideas come from? In 1992, Fama and French found that two simple characteristics, a stock’s size (small vs. large) and valuation (cheap “value” stocks vs. expensive “growth” stocks), explained a lot of differences in stock returns that the market alone didn’t (Fama & French, 1992). Historically, smaller companies and value stocks delivered higher returns than the market, albeit with their own roller-coaster rides. Later research added more “nutrients” to the salad: momentum (stocks that have been going up tend to keep going up briefly), profitability/quality (more profitable firms’ stocks do better), low volatility, etc. By now there’s a whole zoo of factors identified in academia, but as author Larry Swedroe notes, you only need a handful of the major ones to explain most of the differences in portfolio performance (Swedroe & Berkin, 2016), where many other factors do not seem to hold up for a variety of reasons. In fact, Swedroe and co-author Andrew Berkin suggest focusing on just five equity factors (as per the Fama-French Five Factor Model): the market itself, size, value, profitability, and investment. In plainer language: factor investing means tilting your portfolio toward certain types of stocks that, over the long run, have rewarded investors with higher returns (for bearing some extra risk or exploiting behavioral tendencies). It’s grounded in tons of data (and theory). For example, value stocks (those with low prices relative to fundamentals) have on average beaten growth stocks over many decades in many markets, albeit with painfully long dry spells. Small-cap stocks (think scrappy little companies) have outpaced large-caps over the long run (again, not every year). These premiums are believed to be compensation for risk (e.g. small and value companies are often riskier, out of favor, or harder to arbitrage) and/or investor behavioral biases. It is also important to mention that this theory also encompasses more than the factors being established due to just being back-tested in a simple linear regression equation, which some people seem to think (although I will be running some factor regressions for illustration purposes in this post).
Even Burton Malkiel, in the 50th Anniversary edition of A Random Walk, acknowledges that funds targeting these factors, like Dimensional Fund Advisors (DFA) have delivered excess returns in the past. He points out, for instance, that DFA’s small-cap value fund beat the market by over 1% annually in one 10-year stretch. However, he cautions that these higher returns are likely just compensation for higher risk, and “smart beta” strategies can go through long periods of underperformance. Indeed, all factors have rough decades. So Malkiel’s advice is usually to keep the core of your portfolio in broad index funds, and only tilt to factors cautiously, if at all. (He basically says, if you must gamble on a factor, do it around the edges, and don’t pay high fees for it). To sum up: Index funds imply owning the haystack (market beta) at minimal cost, backed by CAPM and EMH. Factor investing implies adding a bit of spice by overweighting certain “nutrients” in the haystack (size, value, etc.) that may deliver extra return. It’s an evolution, not a revolution, built on the same idea of disciplined, diversified investing, just with a rules-based active component. People like Swedroe, Ang, and DFA’s founders (David Booth, Eugene Fama & Ken French, etc.) have championed this approach as a way to potentially improve on plain indexing, without venturing into the dark arts of stock picking or market timing. Now, all this theory is nice, but how does an investor actually implement parts of it, especially someone who is still slightly unconvinced (or just naive) of factors and is looking for an intermediary? That brings us to my personal journey (and mild obsession): moving from the classic Bogleheads three-fund portfolio towards a portfolio that is an intermediary between pure market beta and factor tilting, step by step, and hitting an annoying barrier in the process, finding an equivalent replacement for VXUS (Vanguard’s total international index).
The Three-Fund Portfolio
Let us first start with the beloved Three-Fund Portfolio. As I understand it, it is small, simple, and wise in terms of complexity. The three-fund portfolio typically consists of:
- (1) a total U.S. stock market index fund (like Vanguard Total Stock Market, ticker VTI; Vanguard, 2024),
- (2) a total international stock index fund (like Vanguard Total International, ticker VXUS; Vanguard, 2024)
- (3) a total U.S. bond market fund (like BND).
That’s it. With just three funds, you get exposure to literally thousands of stocks around the globe and the broad U.S. investment-grade bond universe. It’s hard to overstate how much diversification and simplicity you get in this minimalist setup. Bogleheads like Taylor Larimore (Bogleheads Wiki, 2024) (co-author of The Bogleheads’ Guide) tout the three-fund portfolio’s many virtues: extremely low cost, broad diversification, no overlapping holdings, minimal maintenance, and no reliance on any fund manager. You effectively own the entire world’s public markets in one neat package, at a fee that’s often 0.05% or less per year. Tough to beat. Of course, you still have to decide your allocation, i.e. what percentage in each of the three funds. This usually comes down to your risk tolerance, goals, and circumstances. Stocks vs bonds is the big lever (a higher bond percentage is usually seen as safer, but yielding lower long-term returns). And within stocks, how much U.S. vs international? Reasonable people (and unreasonable ones on internet forums) debate the “perfect” ratio. Vanguard’s research suggests anywhere from 20% to 50% of stocks in international is reasonable, with 40% being market-weight (although for their 2026 outlook I just read that Vanguard recommends flipping the amounts of stocks and bonds from 60% stocks and 40% bonds to 60% bonds and 40% stocks, but do not quote me on that). Jack Bogle himself and the earlier mentioned JL Collins were both famously lukewarm on international, preferring an 80/20 or even 100/0 home bias (he believed U.S. companies already have global exposure), which again could be a whole post in and of itself. Meanwhile, others argue for market-cap weights (60% US, 40% international currently). In practice, many Bogleheads split the difference. For example, one common recommendation for a balanced portfolio is 50% VTI (U.S.), 20% VXUS (international), 30% BND (bonds). That would be a 70/30 stock/bond mix, with international making up 29% of stocks. Another example (from Vanguard’s own target-risk funds for retirees) is 40% VTI, 20% VXUS, 40% BND (so 60/40 with 1/3 of stocks international). There’s no single right answer, but the key is these portfolios are broadly diversified and simple. For our purposes here, I’m focusing on the equity portion (the stocks), since that’s where the factor intrigue comes in. Bonds (BND) are important, but they’re not part of the “factor investing” vs “index” debate for this post specifically; so we will simplify and say they’re just for stability for now. So let’s set BND aside and talk VTI + VXUS as the classic equity allocation. How has a basic VTI/VXUS global stock combo performed? Quite well historically, albeit with some U.S. vs international performance cycles that tempt investors to stray. To visualize this, let’s do a quick backtest with some code. We’ll compare different mixes of VTI and VXUS, say from all-U.S. to all-international, and see the historical performance (and we’ll exclude bonds for now, keeping it apples-to-apples for the sake of the following section).
Full code: vti_vxus_mix_comparison.py
Output:
Expense Ratios: VTI 0.03%, VXUS 0.07%

Growth of $1 (Net of Expense Ratios, 2011-2024)
========================================================
Strategy             Final      Total     CAGR     Vol
--------------------------------------------------------
100% US (VTI)        $5.63    +463.4%    13.2%   17.4%
60/40 US/Intl        $3.62    +262.0%     9.7%   17.0%
100% Intl (VXUS)     $1.80     +80.3%     4.3%   17.8%
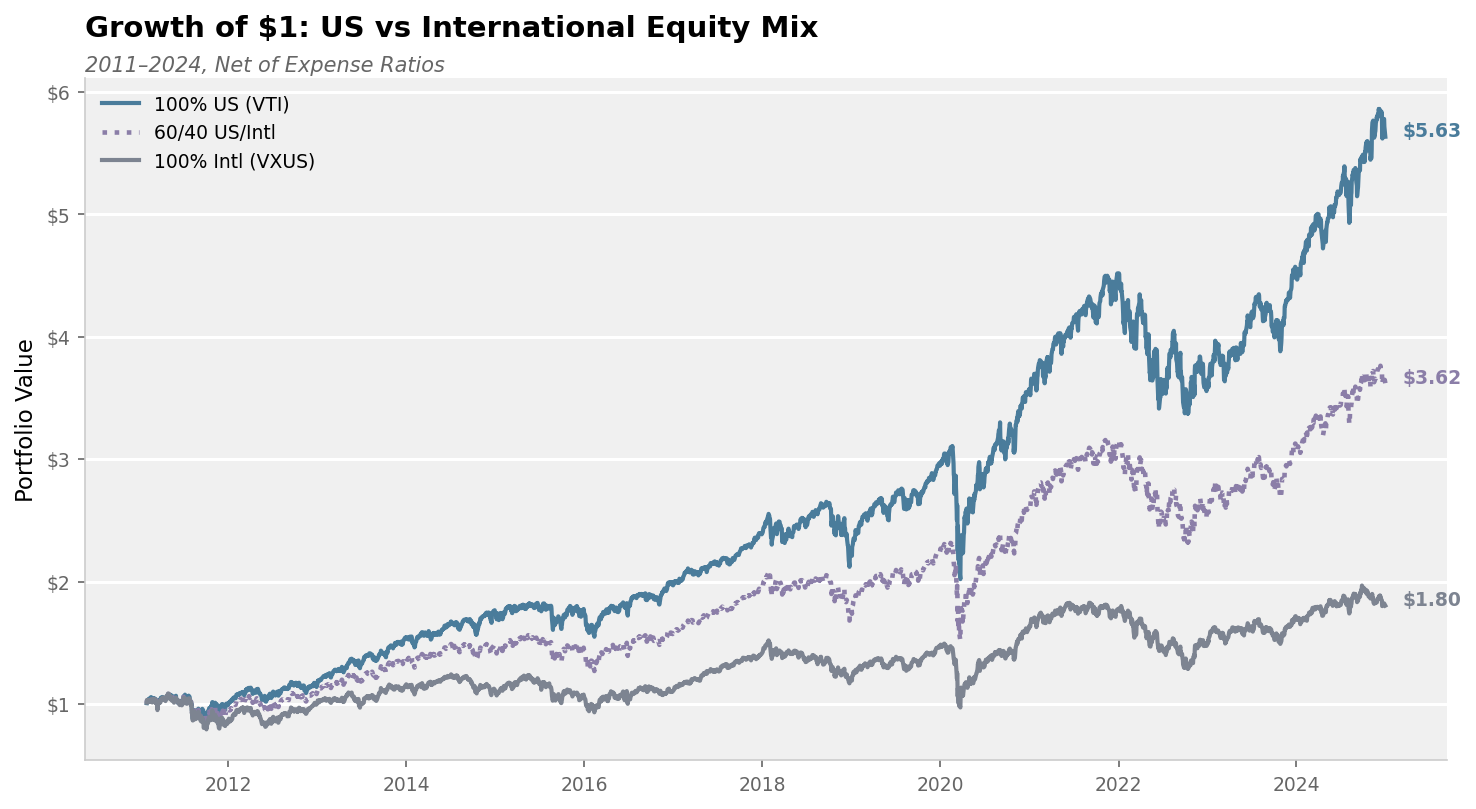
The chart above shows how $1 would have grown in three allocation scenarios, with returns adjusted for each fund’s expense ratio (VTI: 0.03%, VXUS: 0.07%). We also report CAGR (compound annual growth rate) for easy comparison across time periods, and annualized volatility to show the risk side of the equation. The 60/40 US/Intl mix represents roughly global market-cap weighting (also available as the ETF VT).
Running the code, we clearly see that 100% US (VTI) has led the pack in the last decade (U.S. stocks dominated the 2010s), while 100% international (VXUS) lagged. The 60/40 mix falls in between. If this were 2000-2009, the plot would tell the opposite story (that was a lost decade for U.S. stocks and a decent one for international). The lesson here is that global diversification smooths out regional swings. When U.S. stocks zig, internationals often zag. The 60% US / 40% international mix (roughly global market cap weight) is a nice balanced approach, and indeed we see it avoids the extremes. It’s never the very top or bottom performer in any period. That balanced portfolio will be our baseline going forward. Now, as a die-hard Boglehead, you could stop right here. “Two stock funds (plus a bond fund) and chill, as I often see cited in the bogleheads subreddit” is a perfectly fine mantra! So why even consider changing it? Well, recall the earlier discussion: index funds have minor inefficiencies and there might be systematic ways to squeeze out a bit more return. Which brings me to Dimensional Fund Advisors and their “Market-Series” fund offerings like DFUS.
VTI vs DFUS
VTI is the classic total U.S. stock market ETF that buys everything per the index. DFUS (Dimensional U.S. Equity Market ETF) is a relatively new entrant (launched 2021) that covers the same broad U.S. market but doesn’t strictly follow an index. It’s actively managed in a very rules-based way.
Ben Felix of PWL Capital (and Rational Reminder fame) did an excellent analysis comparing DFUS to VTI, arguing that while low-cost total market index funds are excellent, they possess structural inefficiencies that non-indexed funds can improve upon (Felix, 2025). Here’s a high-level summary:
1. The Hidden Cost of Index Rebalancing (Adverse Selection)
Index funds follow rigid rebalancing rules that create an implicit cost not visible in the expense ratio. Companies typically issue new shares when they believe their stock is overpriced, and buy back shares when they think it’s cheap. Because index funds must mechanically buy when firms issue stock and sell when firms buy back, they’re effectively “bad market timers”, essentially always on the wrong side of the trade.
2. Trading Flexibility
DFUS doesn’t follow an index, so it can avoid this adverse selection problem. Instead of trading to match a quarterly snapshot of market composition, DFUS follows trading rules designed to increase expected returns. It can delay buying IPOs, avoid the mechanical buying/selling cycles, and be patient around price movements.
3. Strategic Exclusions
DFUS intentionally excludes specific subsets of the market with historically poor returns:
- Small-cap “junk” stocks: Small growth stocks with weak profitability and aggressive investment, a.k.a. the “small crap” that tends to drag on returns. Despite these exclusions, DFUS maintains essentially the same factor exposure as VTI, as we’ll confirm in the regression analysis below.
- REITs: Excluded as a product design choice for tax efficiency
Thus, while DFUS holds 2,430 stocks versus VTI’s 3,564, those excluded stocks only represent about 3.6% of market cap weight. Of that, 2.6% is REITs and only 1% is the small-cap exclusions. And that excluded 1% of small-cap stocks returned roughly -10% annualized during the sample period, so their absence actually helped performance.
Ben also showed that even when you add a REIT allocation back into the data to match VTI’s composition, DFUS still shows an excess return, which aligns perfectly with the research on index rebalancing costs. The REIT exclusion is primarily for tax reasons; the outperformance comes from avoiding the structural inefficiencies.
4. Addressing the Historical Record
Some point out that DFUS’s predecessor mutual fund (DTMEX) underperformed VTI from 2001-2021. But this isn’t representative of current expectations: DTMEX had higher fees (up to 0.22% vs VTI’s 0.03%), different tax management constraints, and the specific small-cap exclusion rules were based on research that hadn’t been conducted yet when DTMEX launched.
As an investor who wants to “do slightly better if possible, without fundamentally changing my exposure,” DFUS is compelling (DFA, 2024; Felix, 2025). It’s basically VTI 2.0 if I understand things correctly, same broad market exposure, just optimized on the margins.
Let’s see how DFUS vs VTI have actually performed. The chart below shows growth of $1 since DFUS’s inception, with returns adjusted for expense ratios (VTI: 0.03%, DFUS: 0.09%):
Full code: vti_dfus_comparison.py
Output:
Performance since DFUS inception (2021-06-14):
========================================================
Expense Ratios: VTI 0.03%, DFUS 0.09%

Fund        Final      Total     CAGR     Vol
--------------------------------------------------------
VTI         $1.38     +38.2%     9.6%   17.3%
DFUS        $1.43     +43.1%    10.6%   17.1%
--------------------------------------------------------
DFUS Outperformance: +4.9% total, +1.1% CAGR
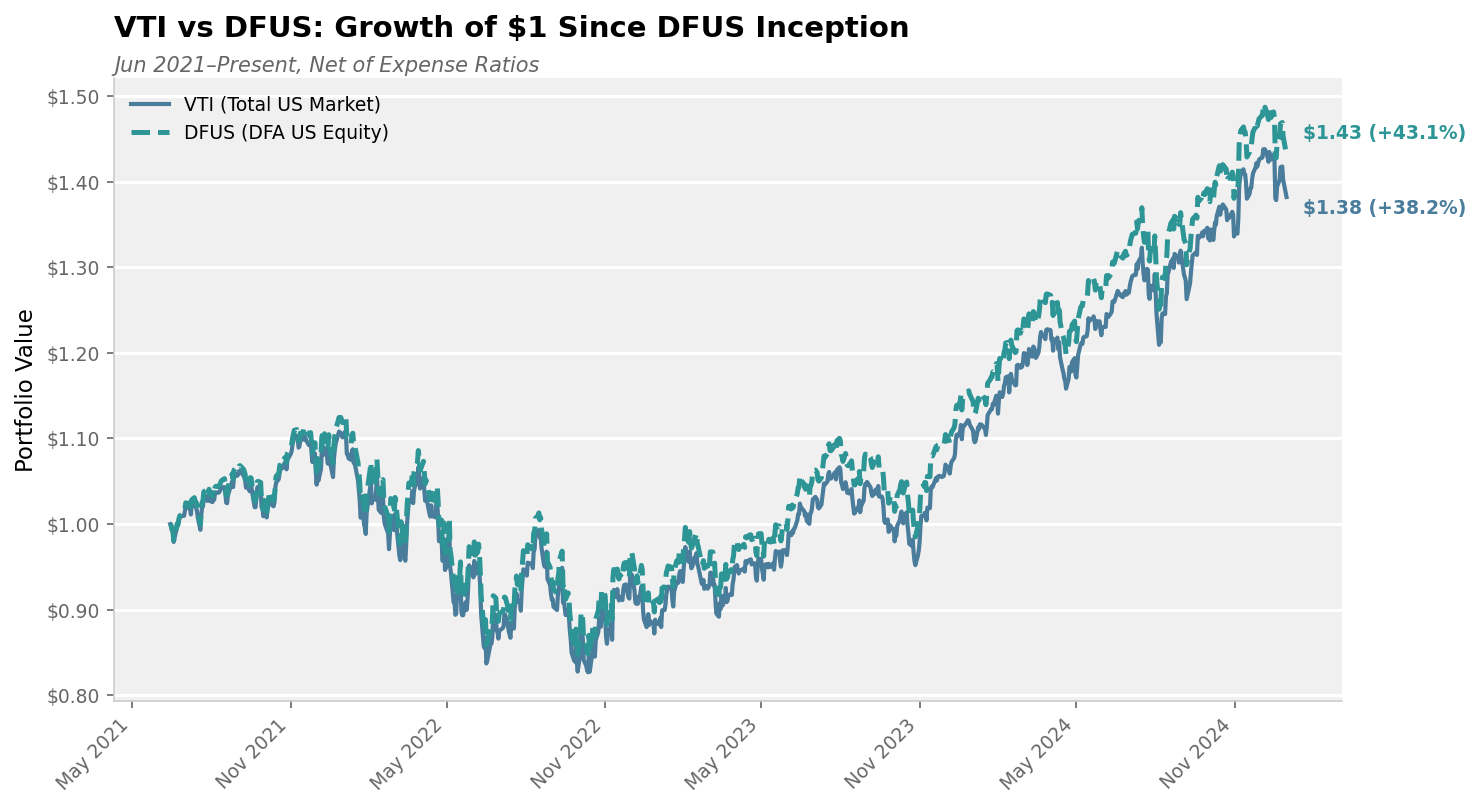
The data shows DFUS pulling ahead by about 5 percentage points cumulatively, with a CAGR advantage of roughly 1% annually. Not life-changing, but meaningful over decades, and achieved with nearly identical volatility. The key is DFUS did it while providing the same broad market exposure.
Importantly, this isn’t just hand-waving — the factor regression analysis below confirms that VTI and DFUS have nearly identical factor loadings (market beta around 1.0, all other factors around 0). They’re the same systematic risk exposure. The outperformance comes from implementation, not hidden factor bets.
At this point, I was pretty sold on replacing VTI with DFUS for U.S. equity exposure. It’s a classic cheap lunch story: essentially the same exposure, potential for slightly better returns, better tax efficiency, for nearly the same low fee.
Alright, U.S. stocks accounted for, let us move to the international side, where things are definitely not as straightforward.
The International Challenge
Vanguard’s VXUS (Total International Stock ETF) is the international analog to VTI: a cap-weighted index of all non-U.S. stocks in both developed and emerging markets. VXUS is cheap (0.07% expense ratio) and very broad (around 7,500 stocks in 45 countries). If I want to replicate my DFUS logic abroad, I’d look for a DFA ETF that does “total international” with similar slight improvements. However, no single DFA ETF seems to be a perfect VXUS equivalent at the moment, especially not with the ultra-low fee and simplicity of DFUS.
Here’s the landscape as I understand it: DFA chose to split the world ex-US into two pieces, one for developed markets and one for emerging markets. These are DFAI (Dimensional International Core Equity Market ETF) and DFAE (Dimensional Emerging Core Equity Market ETF). Both are actively managed, factor-oriented funds (the “Core Equity” name hints that they tilt toward size/value/profitability, akin to DFA’s classic strategies). To mirror VXUS (which is 75% developed, 25% emerging by market cap), you’d have to hold both DFAI and DFAE in roughly that ratio. That’s doable, but it’s more complicated than a single fund, and crucially the fees are higher. As of now, DFAI’s expense ratio is 0.18% and DFAE’s is 0.36% (emerging markets funds tend to cost more). Blending 75/25, the weighted expense comes out to 0.23%, around triple VXUS’s fee. Not outrageous, but it gives one pause.
What about performance and approach? DFAI and DFAE are tilted funds. According to DFA, DFAI invests in companies of all sizes in developed markets, but with “increased exposure to smaller capitalization, lower relative price, and higher profitability” stocks. Likewise, DFAE targets emerging market stocks with an emphasis on value and profitability. They’re not trying to match the index; they’re trying to beat it by systematically overweighting those factors. So even though DFA lists these funds under their market funds, they actually do contain factor tilts. Over long periods, they could outperform VXUS (just as DFA’s other factor funds have often beaten cap-weight indices historically, but again that is not within the scope of this post). They will also deviate more from VXUS in the short term.
Additionally, Dimensional does offer one single ETF for international: DFAX (Dimensional World ex-US Core Equity 2 ETF). DFAX bundles developed and emerging in one fund (closer to a VXUS counterpart). But two issues:
(1) Its expense ratio is 0.23%, higher than VXUS (because “Core 2” means heavier tilts toward small/value with more trading and more costs).
(2) It’s actively tilting quite a bit, so it’s definitely not a plain-vanilla index replacement, as DFUS is to VTI. DFAX is essentially the next step on the factor continuum, a factor fund for international stocks.
Let’s see how DFAX has done vs VXUS. The chart below shows growth of $1 since DFAX’s inception, with returns adjusted for expense ratios (VXUS: 0.07%, DFAX: 0.23%):
Full code: vxus_dfax_comparison.py
Output:
Performance since DFAX inception (2021-09-13):
========================================================
Expense Ratios: VXUS 0.07%, DFAX 0.23%

Fund        Final      Total     CAGR     Vol
--------------------------------------------------------
VXUS        $0.99      -0.6%    -0.2%   16.0%
DFAX        $1.01      +1.0%     0.3%   15.7%
--------------------------------------------------------
DFAX Outperformance: +1.6% total, +0.5% CAGR
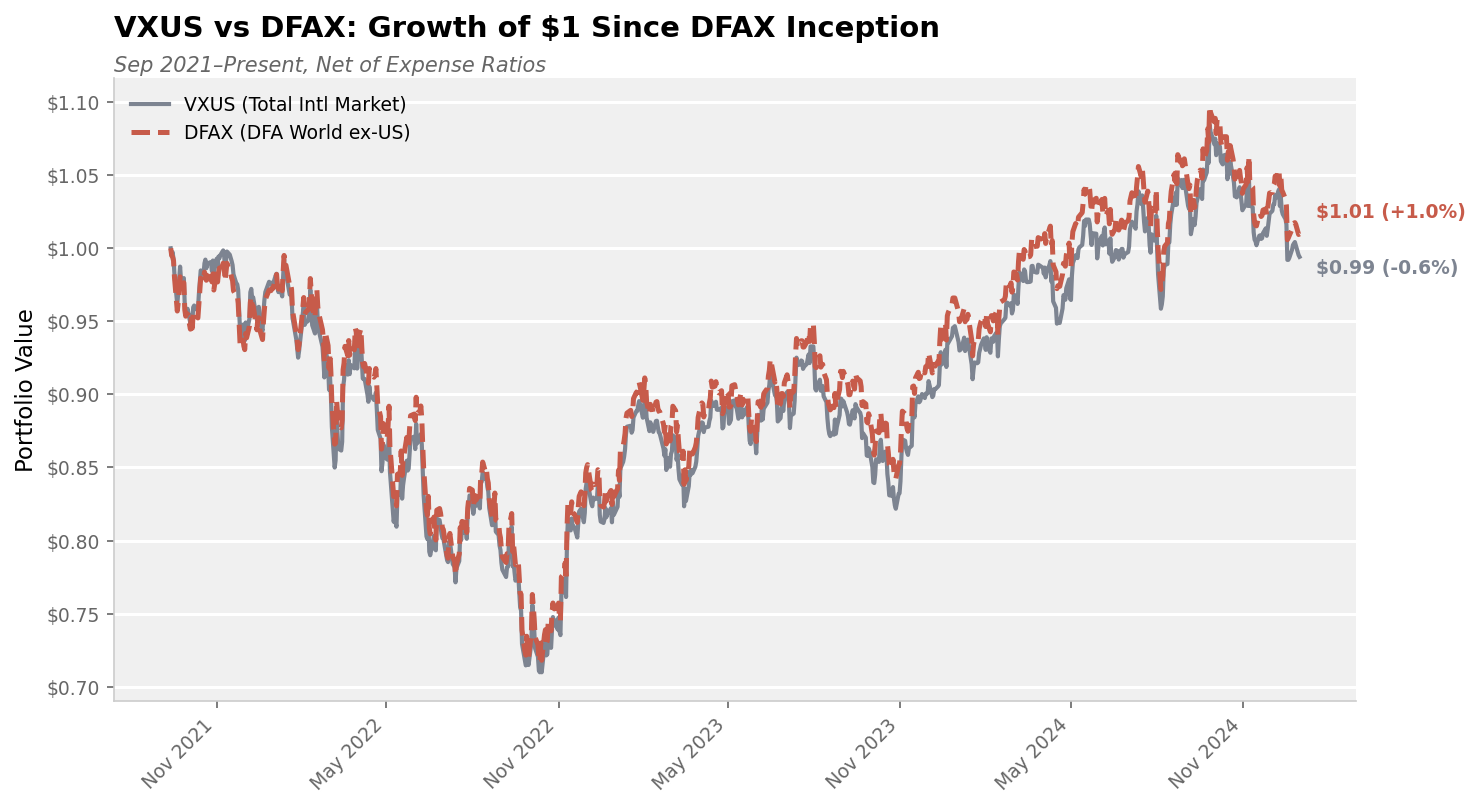
The data shows DFAX modestly outperforming VXUS, with a CAGR advantage of roughly 0.5% annually. Interestingly, DFAX achieved this with slightly lower volatility than VXUS (15.7% vs 16.0%), suggesting the factor tilts provided some diversification benefit. The outperformance is smaller than DFUS vs VTI, which makes sense: DFAX is fighting against a higher expense ratio differential (0.16% vs 0.06%) and the factor premiums have been more muted internationally in this short period.
Unlike the VTI/DFUS comparison, this is not an apples-to-apples comparison. The factor regression analysis below shows that DFAX has meaningful factor tilts relative to VXUS: +0.21 on value (HML), +0.21 on profitability (RMW), and +0.17 on size (SMB). DFAX is taking different systematic risks than VXUS. It is a factor-tilted fund, not a pure market-beta replacement.
Quantifying Factor Exposures: 5-Factor Regressions
To move beyond intuition and actually measure whether DFUS is a true VTI equivalent (and whether DFAX differs from VXUS), we can run Fama-French 5-factor regressions (Fama & French, 2015). This decomposes each ETF’s returns into exposure to five systematic risk factors: Market (Mkt-RF), Size (SMB), Value (HML), Profitability (RMW), and Investment (CMA). If two funds have similar factor loadings, they have similar risk profiles regardless of their labels.
Full code: factor_regression_analysis.py
Output:
Fama-French 5-Factor Regression Results (2021-2024, 39 months)
======================================================================
ETF      Alpha%   Mkt-RF      SMB      HML      RMW      CMA     R²
----------------------------------------------------------------------
VTI      -0.32%    1.000    0.014   -0.006    0.026    0.032  0.999
DFUS      0.18%    0.996   -0.012    0.001    0.049    0.043  0.999
VXUS     -0.85%    1.014   -0.386   -0.101   -0.194    0.089  0.992
DFAX     -1.83%    1.040   -0.214    0.112    0.014    0.051  0.989
----------------------------------------------------------------------
Note: Alpha is annualized. Factor loadings near zero = no tilt.
The results confirm our thesis:
US (VTI vs DFUS): Both have market beta around 1.0 and factor loadings essentially at zero. DFUS is a true VTI equivalent with the same systematic risk exposure. The slight positive alpha (+0.18% annualized) hints at implementation benefits, though not statistically significant over this short period.
International (VXUS vs DFAX): Here the story differs. DFAX shows meaningful tilts relative to VXUS:
- Value (HML): +0.21 (DFAX tilts toward cheaper stocks)
- Profitability (RMW): +0.21 (DFAX tilts toward more profitable companies)
- Size (SMB): +0.17 (DFAX is less large-cap biased than VXUS)
This quantitatively proves that DFAX is not a VXUS replacement, given it is a factor-tilted fund with fundamentally different risk exposures.
From a factor perspective: VXUS is basically pure market beta (by design, it’s cap-weighted), though interestingly it shows negative loadings on profitability and size, meaning cap-weighting naturally overweights large, less profitable companies. DFAX is the market beta plus moderate tilts to value, profitability, and smaller stocks. In plain English, DFAX takes more of its risk in smaller, cheaper, and more profitable stocks. That’s been decent recently (2022-2023 were okay for value globally), hence the modest outperformance.
If I were ready to fully embrace factor investing, I might pair DFAC (Dimensional US Core 2) with DFAX for a complete globally tilted portfolio. In fact, DFAC+DFAX is essentially DFA’s “equity core” solution with high expected returns, higher factor exposure, and still being broadly diversified. However, I’m not quite ready to go “full factor” with all my equities. Tilting adds tracking error that can test one’s patience. If I tilt too much and hit a decade of underperformance, will I lose faith and capitulate at the worst time? Possibly. That’s an important self-check.
Thus, my current plan is incremental improvement: start with DFUS over VTI for U.S., and continue searching for a win on the international side. Unfortunately, that “VXUS 2.0” hasn’t materialized in the form of a single DFA or Avantis ETF with broad market coverage, mild tilts, and low fee.
Avantis Investors (founded by ex-DFA people) also offers international factor funds but similarly split: AVDE (developed international, 0.23% fee) and AVEM (emerging, 0.33% fee). They too expect you to mix your own VXUS cocktail with no simple one-ticker solution there either. Either way, I’m stuck with a two-fund combo for international that is not ideal for several aforementioned reasons.
Why doesn’t a DFA International Equity Market ETF exist, analogous to DFUS? My guess: DFA’s philosophy is that outside the U.S., the benefits of tilting are even more compelling (and perhaps the costs of indexing even higher), so they didn’t bother with a plain “market” version. International markets are less efficient in some cases, and DFA probably figures investors going with them want the tilts. Another reason might be that their mutual fund conversions naturally split that way (they had separate funds for International and Emerging originally, no single total international mutual fund to convert). In the end, Vanguard’s VXUS is so cheap that competing directly on a plain cap-weighted ex-US index might not be profitable for DFA/Avantis, but these are all just some half-baked theories I have.
As a result, I find myself in a conundrum: I can’t get a DFUS-like upgrade for VXUS without accepting higher fees or more complexity. This bothers an optimizer like me.
For now, my plan is to stick with VXUS for international while I continue researching and gaining comfort with the DFAI/DFAE or DFAX approach. If factor tilts keep proving their worth and are not decaying (as more recent research seems to indicate) and I spend more time convincing myself when I read the more recent literature, I could eventually transition fully. But I’m not there yet emotionally or intellectually.
References
Books
Malkiel, B. G. (2023). A Random Walk Down Wall Street: The Time-Tested Strategy for Successful Investing (50th Anniversary Edition). W. W. Norton & Company. ISBN: 978-0393358389.
https://wwnorton.com/books/9781324035435
Collins, J. L. (2016). The Simple Path to Wealth. JL Collins LLC. ISBN: 978-1533667922.
https://www.simplepathtowealth.com/
Swedroe, L. & Berkin, A. (2016). Your Complete Guide to Factor-Based Investing: The Way Smart Money Invests Today. Harriman House. ISBN: 978-0857195387.
https://www.amazon.com/Your-Complete-Guide-Factor-Based-Investing-ebook/dp/B01N7FCW2D
Ang, A. (2014). Asset Management: A Systematic Approach to Factor Investing. Oxford University Press. ISBN: 978-0199959327.
https://global.oup.com/academic/product/asset-management-9780199959327
Larimore, T., Lindauer, M., & LeBoeuf, M. (2014). The Bogleheads’ Guide to Investing (2nd ed.). Wiley.
Academic Papers
Markowitz, H. (1952). Portfolio Selection. The Journal of Finance, 7(1): 77–91.
https://doi.org/10.1111/j.1540-6261.1952.tb01525.x
Sharpe, W. F. (1964). Capital Asset Prices: A Theory of Market Equilibrium under Conditions of Risk. Journal of Finance, 19(3): 425–442.
https://doi.org/10.2307/2977928
Fama, E. F. (1970). Efficient Capital Markets: A Review of Theory and Empirical Work. Journal of Finance, 25(2): 383–417.
https://doi.org/10.2307/2325486
Fama, E. F. & French, K. R. (1992). The Cross-Section of Expected Stock Returns. Journal of Finance, 47(2): 427–465.
https://doi.org/10.1111/j.1540-6261.1992.tb04398.x
Fama, E. F. & French, K. R. (2015). A Five-Factor Asset Pricing Model. Journal of Financial Economics, 116(1): 1–22.
https://doi.org/10.1016/j.jfineco.2014.10.010
Videos & Multimedia
Felix, B. (2025). Comparing U.S. Equity ETFs: VTI vs. DFUS. Rational Reminder / YouTube.
https://youtu.be/lMdGA0ePXzI?si=L3kO7xyAme3sC0fD
Industry Sources
Dimensional Fund Advisors. (2024). DFUS - US Equity Market ETF.
https://us.dimensional.com/funds/us-equity-market-etf-dfus
Dimensional Fund Advisors. (2024). DFAI - International Core Equity Market ETF.
https://us.dimensional.com/funds/international-core-equity-market-etf-dfai
Dimensional Fund Advisors. (2024). DFAE - Emerging Core Equity Market ETF.
https://us.dimensional.com/funds/emerging-core-equity-market-etf-dfae
Dimensional Fund Advisors. (2024). DFAX - World ex-US Core Equity 2 ETF.
https://us.dimensional.com/funds/world-ex-us-core-equity-2-etf-dfax
Vanguard. (2024). VTI - Total Stock Market ETF.
https://investor.vanguard.com/investment-products/etfs/profile/vti
Vanguard. (2024). VXUS - Total International Stock ETF.
https://investor.vanguard.com/investment-products/etfs/profile/vxus
Avantis Investors. (2024). AVDE - International Equity ETF.
https://www.morningstar.com/etfs/arcx/avde/quote
Avantis Investors. (2024). AVEM - Emerging Markets Equity ETF.
https://www.avantisinvestors.com/avantis-investments/avantis-emerging-markets-equity-etf/
Web Resources
Bogleheads Wiki. (2024). Three-Fund Portfolio.
https://www.bogleheads.org/wiki/Three-fund_portfolio
Morningstar. Fund Pages & Factor Exposures.
https://www.morningstar.com/
Data Sources
Tiingo. (2024). Financial Data API. Historical end-of-day price data used for all performance calculations and visualizations in this post.
https://www.tiingo.com/
French, K. R. (2024). Data Library. Fama-French 5-factor returns (US, Developed ex-US, and Emerging Markets) used for factor regression analysis.
https://mba.tuck.dartmouth.edu/pages/faculty/ken.french/data_library.html